Chapter 4 of 7 · 2018–2025
The Medicaid Explosion
Fourteen Medicaid programs grew from $1.5 billion to $4.3 billion a year. Prosecutors put the fraud at half or more.
House Fraud Committee: Housing Stabilization Services and Integrated Community Supports, September 17, 2025 · full record
Source: Minnesota House of Representatives (MNHouseInfo) · watch the original on YouTube. Played here unaltered except as noted on this page; rights remain with the publisher.
In one minute
- Minnesota was the first state to offer Housing Stabilization Services. It was expected to cost $2.6 million a year. When DHS suspended 77 providers, they had received more than $88 million. report p. 34 report p. 38
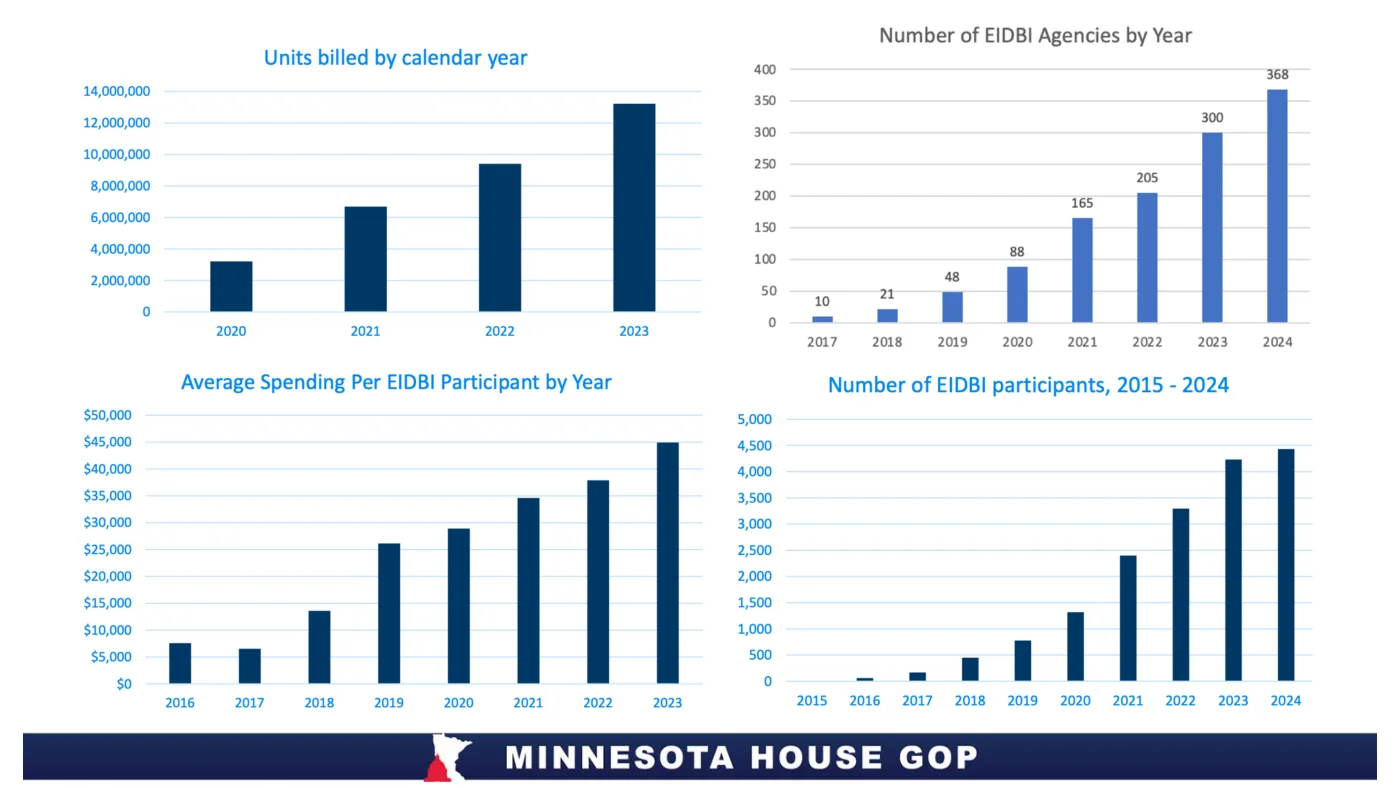
- An outside analysis of the 14 high-risk programs flagged 90% of autism-services (EIDBI) payments as problematic. report p. 42
- 97% of new assisted-living licenses statewide were for six beds or fewer, below the size that needs a full license. report p. 59
- A whistleblower testified he was offered an $1,800 apartment for $600 if he signed up for services, which were then billed and not delivered. report p. 51 report p. 52
- The First Assistant U.S. Attorney estimated that half of the $18 billion spent on the 14 programs was fraudulent. report p. 39 Thompson press conference, FOX 9 live
“However, reimbursements quickly skyrocketed beyond expectations, and the program was flooded with new providers.”
“DHS reported 77 providers with payment suspensions due to fraud. The total amount received by these fraudulent providers exceed $88 million, which represented the overwhelming majority of HSS payments”
$18Bbilled by the 14 high-risk programs since 2018, per the CMS pull Thompson read
half or moreThompson's reading of that file, December 18, 2025
$1.51B → $4.32Bthe 14 programs, 2018 to 2025
$6.1M → $443Mautism services (EIDBI), 2018 to 2025
~$250Mcharged loss in the meal case; Bock: 500 months, $243M restitution
64 → 36assistant U.S. attorneys in the Minnesota office
Charged dollars are the floor. The claims file is the measurement. They are different numbers and this site keeps them apart.
From the committee's own documents
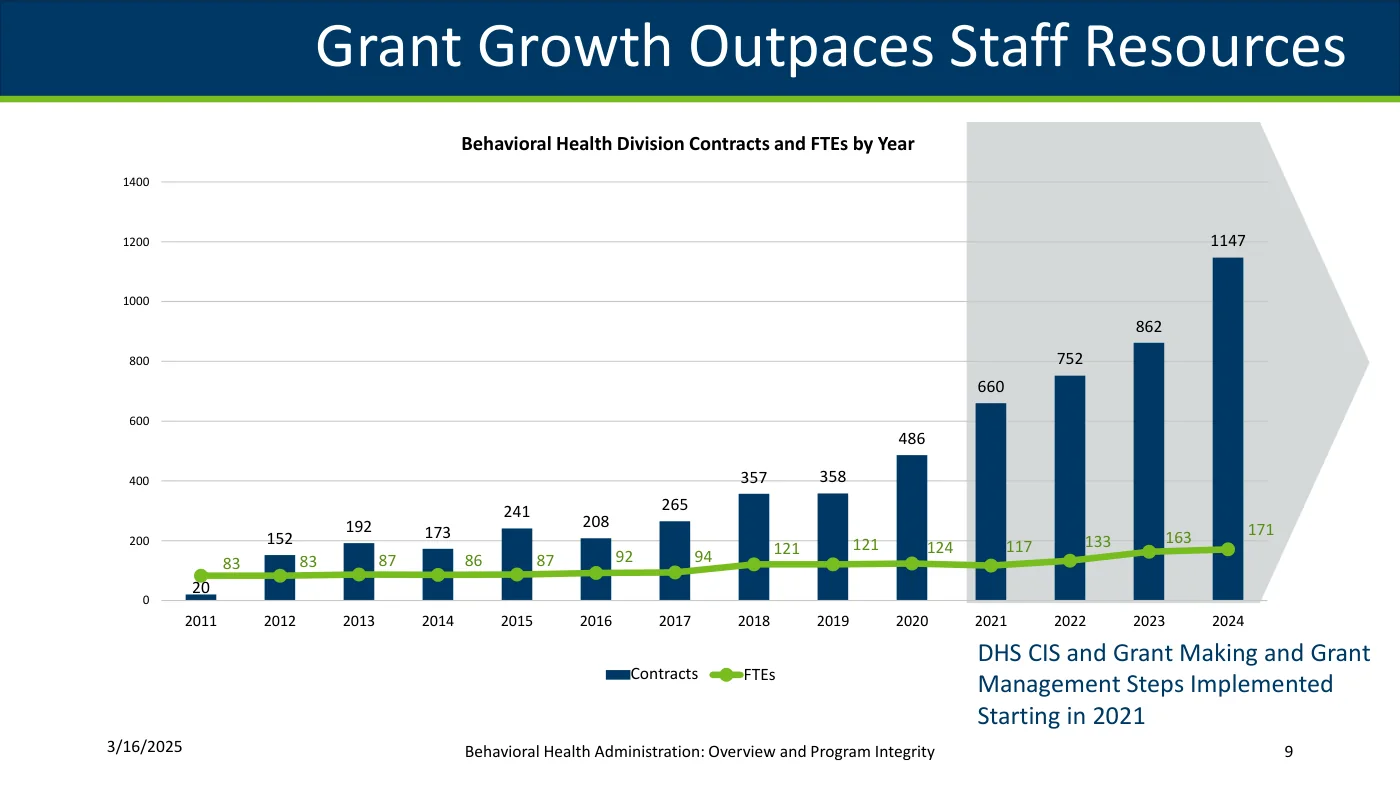
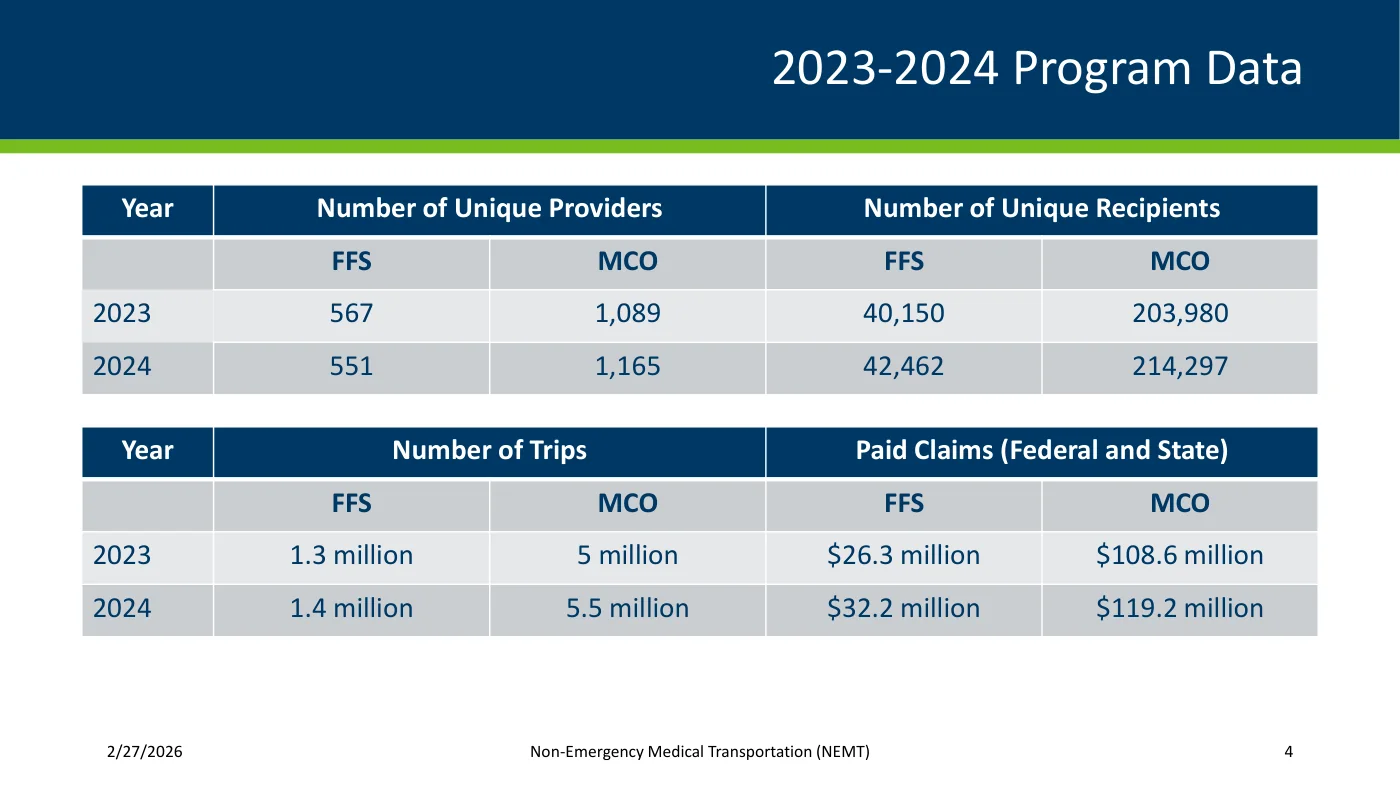
The map
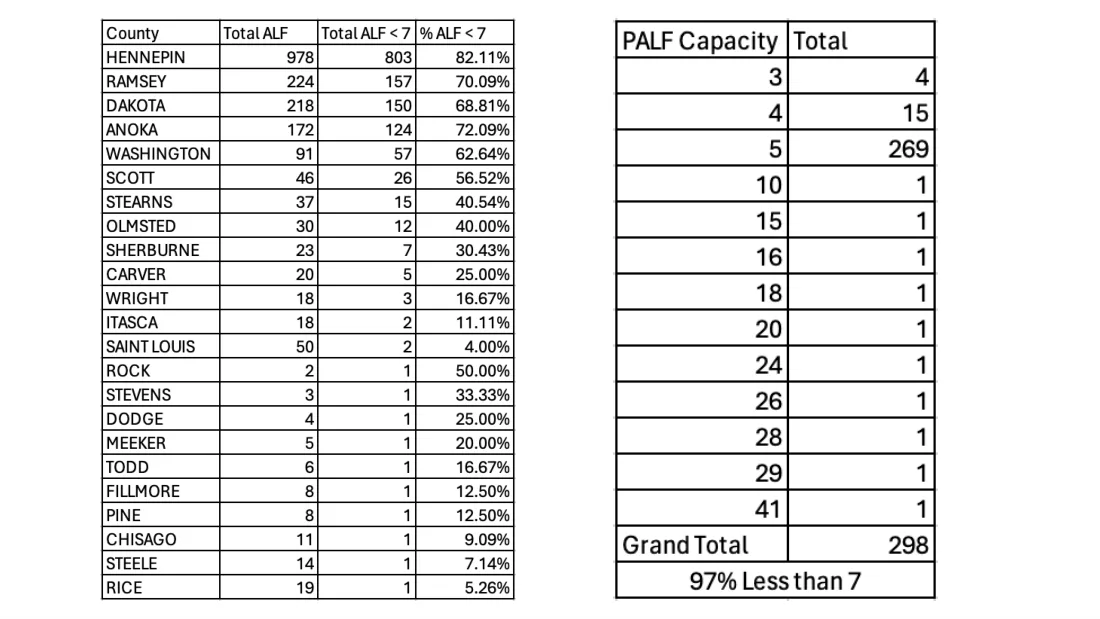
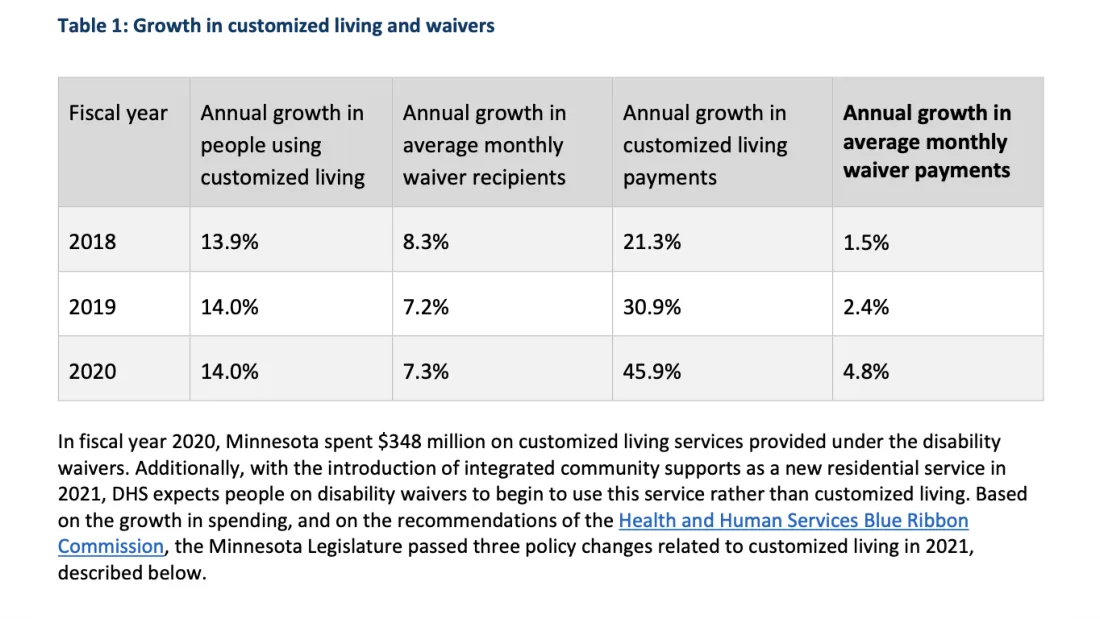
Source: Assisted Living Slides, House Fraud Committee hearing, Dec 17, 2025 (committee document, as presented by Rep. Robbins)
Go deeper
Report: Housing Stabilization ServicesPages 34–41, searchable.Report: EIDBI / Autism ServicesPages 42–50, searchable.Report: Integrated Community SupportsPages 51–53, searchable.Report: Adult Day ServicesPages 54–56, searchable.Report: Assisted Living / Customized LivingPages 57–62, searchable.Report: Nonemergency Medical TransportationPages 63–66, searchable.
People
The record for this chapter
- The 14 high-risk Medicaid programs program
- Housing Stabilization Services program
- EIDBI, early intensive autism services program
- Individualized Home Supports program
- Integrated Community Supports program
- Night supervision program
- Fraud Committee: DHS Behavioral Health Administration hearing
- Fraud Committee: Medicaid fraud in Minnesota hearing
- Fraud Committee: Housing Stabilization Services & Integrated Community Supports hearing
- Housing Stabilization Services ends event
- Thompson press conference, FOX 9 live video
- Thompson press conference, CBS video
- Fraud Committee: Early Intensive Developmental Behavioral Intervention hearing
- Autism providers and the new licensure requirement: 6 of 500, then 433 of 481 event
- Fraud Committee: Nonemergency Medical Transportation hearing
- DHS revalidation: 3,411 of 5,583 high-risk providers disenrolled (61%) document
- NUWAY Alliance FCA case
- May 21 2026 Medicaid takedown case