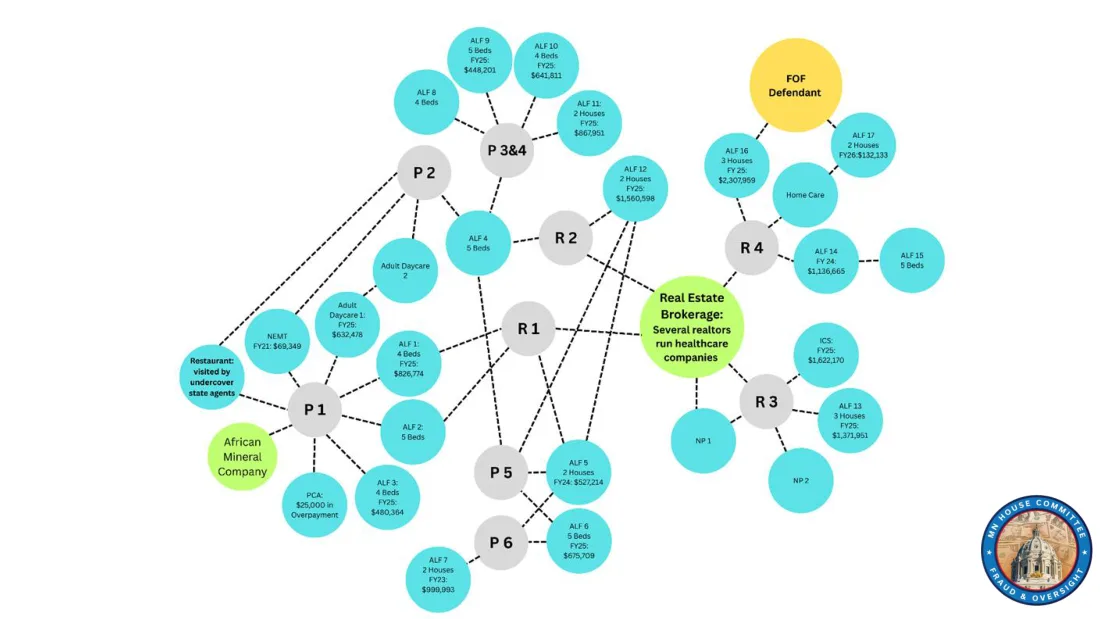
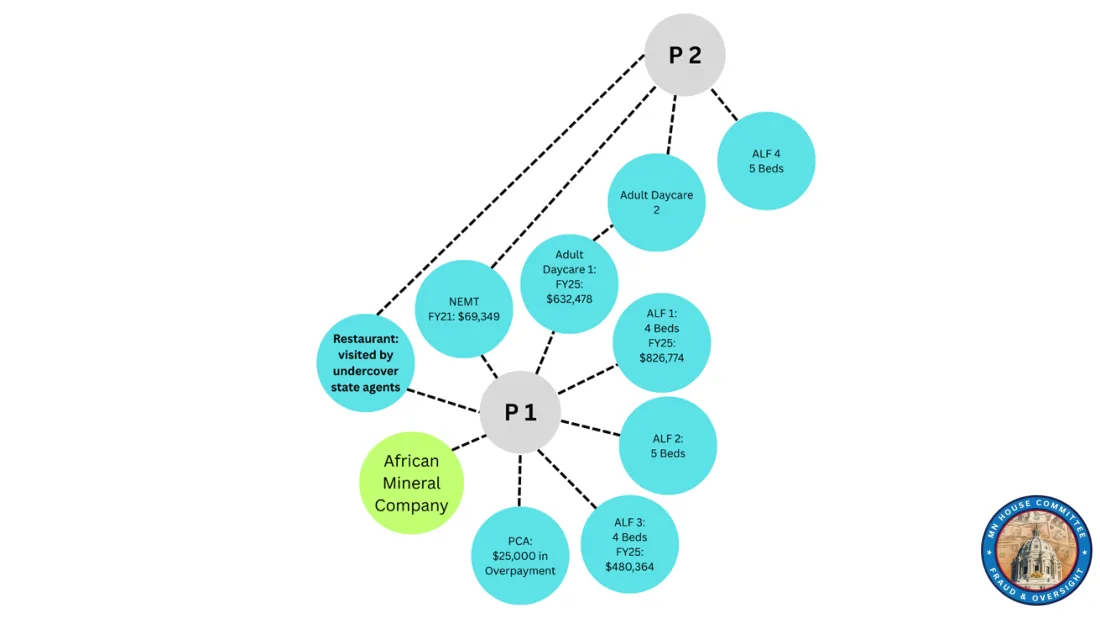
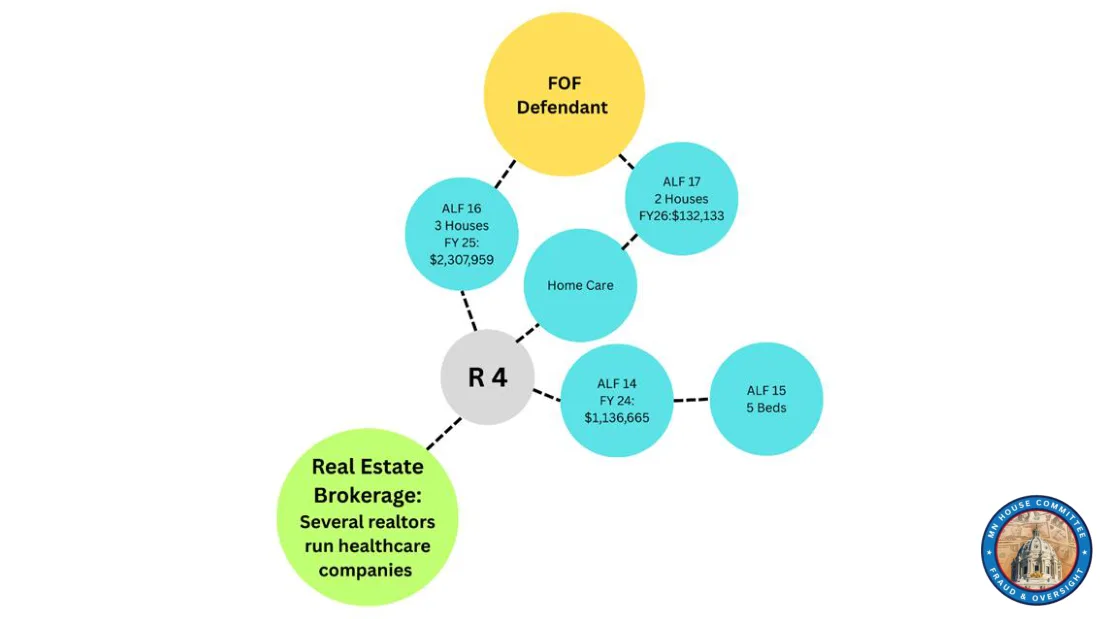
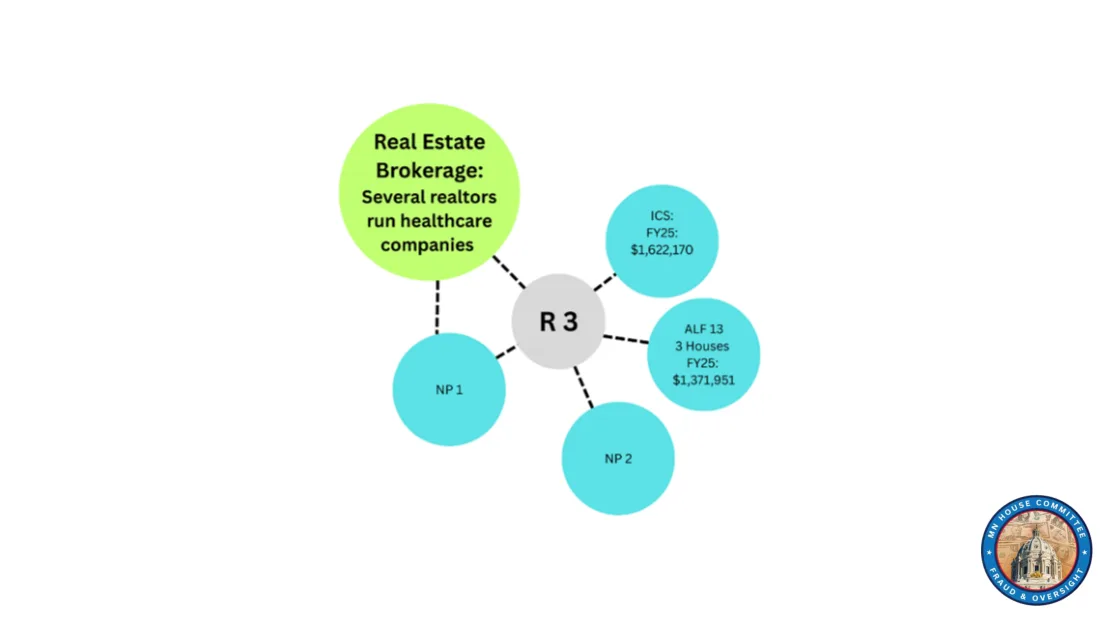
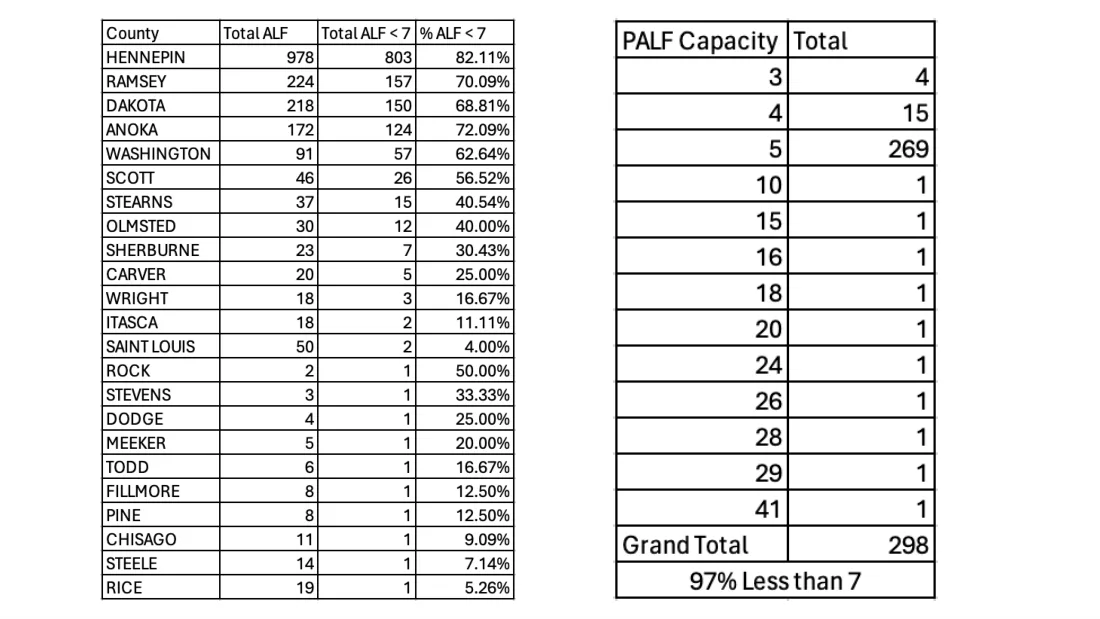
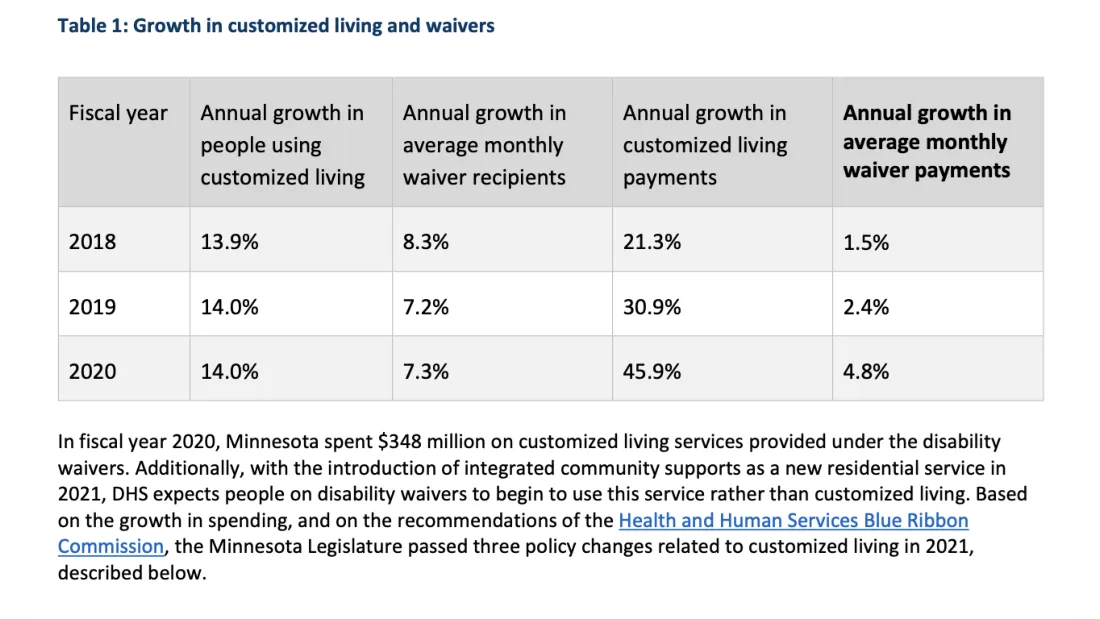
The network as presented: people (P1-P6), realtors (R1-R4), assisted-living houses, adult day centers and other businesses, with state payments by fiscal year. One node is marked as a Feeding Our Future defendant. The committee's slides are anonymized; so is this.Cluster P1: one person's businesses (medical transportation, adult day, three small assisted-living homes, a personal-care business) and a restaurant whose address they share, marked as visited by undercover state agents.Cluster R4: a realtor tied to assisted-living houses and a home-care business, linked to a Feeding Our Future defendant and to a brokerage where several realtors run health-care companies.Cluster R3: a realtor tied to an Integrated Community Supports provider, assisted-living houses and two nonprofits, at the same brokerage.Assisted-living facilities by county and the share under seven beds; provisional licenses by capacity: 298 in all, 97% under seven beds. The report states the same 97% on page 59.Growth in customized living and waiver payments, fiscal 2018-2020, as shown in the deck.